The Cotabambas project is a porphyry copper-gold-silver deposit, located 48 km south west of the city of Cusco, in the Apurimac region in Southern Peru.
The Cotabambas project is comprised of two clusters of mineralized areas:
- Cluster 1 - located in the northeast area of the property has six mineralized porphyries covering an area of 3km x 6km, hosted by an igneous/volcanic environment; and
- Cluster 2 - located in the central and southwest area of the property where the mineralized porphyries intrude the contact between the diorite batholite and limestones generating skarn mineralization.
To date, 98% of the exploration drilling is concentrated in Cluster 1 and the potential in the skarn zones has only recently began being drilled.
EXPLORATION CAMPAIGNS
Antofagasta Minerals, 1995 to 2002
In 1995, Anaconda Perú S.A., a Peruvian subsidiary of Antofagasta Plc (Antofagasta), carried out mapping, soil and rock geochemical sampling programs, and geophysical surveys over the Ccalla, Ccochapata, Azulccacca, and Guaclle exploration targets in Cluster 1 of the Project.
The first diamond drill testing and surface soil and rock geochemical and geophysical anomalies testing begin in July 1996. Intermittent drilling continued until April 2000. In this period a total of 24 drill holes totaling 8,538 m were completed, with numerous mineralized intervals intersected. The results were reported on internal company reports by Val d’Or (1996) and Perello et al. (2001).
Cordillera de las Minas, 2002 to 2006
Antofagasta and Companhia do Rio Vale Doce (CVRD) formed a joint venture company called Cordillera de las Minas (CDLM) in 2002, and transferred ownership of several groups of exploration concessions in southern Perú to CDLM.
From 2002 to 2006, CDLM carried out additional mapping, surface rock and soil geochemical sampling, induced polarization (IP) surveying, magnetometer surveying, and diamond drill testing of previously identified geological, geochemical, and geophysical anomalies. In total, nine drill holes totalling 3,252 m were drilled.
Panoro Minerals, 2007 to Present
In March 2007, Panoro acquired the Cotabambas project from CDLM.
From 2011 to present, Panoro completed additional mapping, surface rock and stream sediment geochemical sampling, IP surveying, and magnetometer surveying. The company focused firstly on Cluster 1 before expanding its programs to Cluster 2. Panoro also conducted diamond drill testing of geological, geochemical, and geophysical anomalies in Ccalla and Azulccacca deposits. In total, 121 holes (63,198 m) to February 2014.
In 2017 Panoro completed a campaign of 30 drill holes (6,632.62 m) in the Breccia, Maria Jose, Cateo, Petra and David exploration targets located next to the mineral resources areas in Cluster 1. In 2018 Panoro completed a 6-hole campaign (2,172.60 m) at Maria Jose and Petra targets, and in parallel mapping and rock sampling in Guaclle and Chaupec exploration targets. In 2019 Panoro completed a campaign of 5 holes (992.70 m) in Chaupec target in Cluster 2.
The 2017 - 2019 exploration work has identified new Cu, Au, Ag mineralization with exploration potential in Maria Jose (hosted in volcanics), Petra-David (porphyry), Guaclle (Skarn) and Chaupec (Skarn) was discovered.
Table 1: Summary of Drilling Campaigns
| Year | Number of Holes | Meters |
|---|---|---|
| 1995 | 24 | 8,538 |
| 2002 | 10 | 3,252 |
| 2007 | 29 | 17,785 |
| 2012 | 81 | 40,467 |
| 2013 | 11 | 4,946 |
| 2017 | 30 | 6,633 |
| 2018 | 6 | 2,173 |
| 2019 | 5 | 993 |
| Total | 196 | 84,786 |
Mineral Resources Estimate by AGP 2024
In February 2024 AGP Mining Consultants amended a NI 43-101 report updating the mineral resources estimate, including 507.3 million tonnes at 0.34%Cu, 0.20 g/t Au, 2.42 g/t Ag and 0.0021%Mo, and 0.43%CuEq grade as Indicated category and 496.0 million tonnes at 0.27% Cu, 0.17 g/t Au, 2.53 g/t Ag and 0.0027%Mo, and 0.36%CuEq grade as Inferred category.
A higher grade component within the optimized pit constraint, demonstrating the potential for a high grade starter pit for the project start up.
Highlights
- A Higher Grade Component of Indicated resource delineated:
- 129.0 million tonnes at 0.70% Cu, 0.44 g/t Au, 4.12 g/t Ag and 0.0014%Mo, and 0.91% CuEq grade, at a cut-off of 0.5% CuEq;
- The higher grade component is present within the optimized pit constraint. Tables 5 and 6 show the Mineral Resources at a 0.5% CuEq cut-off grade.
- 129.0 million tonnes at 0.70% Cu, 0.44 g/t Au, 4.12 g/t Ag and 0.0014%Mo, and 0.91% CuEq grade, at a cut-off of 0.5% CuEq;
- Indicated mineral resources has increased by 333%
- Increased from 117.1 million tonnes to 507.4 million tonnes; and
- constitutes 51% of total resources
- Inferred mineral resources has reduced by 18%
- Decreased from 605.3 million tonnes to 496.0 million tonnes; and
- constitutes 49% of total resources
- Contained Metals have increased:
- 6.7 billion pounds Copper, 29% increase;
- 6.0 million ounces Gold, 43% increase;
- 79.8 million ounces Silver, 43% increase; and
- 53.7 million pounds Molybdenum, 85% increase
- Waste:Mineral ratio reduced
- from 2:1 to 0.65:1 for the Base Case
- Resource remains open to northeast and southwest and at depth
- Multiple new exploration targets identified into the Cotabambas property.
- Strong Community relations demonstrated over more than a decade.
- Current environmental permit allows an additional 450 drilling platforms.
The technical report is posted on SEDAR and a link to the report in included below.
February 26, 2024 Technical Report on the Cotabambas Copper Gold Project
Mineral Resource Estimate
AGP Mining Consulting discloses a new resource estimate for the Cotabambas copper and gold deposit, prepared in accordance with the CIM Best Practices and disclosed in accordance with NI 43-101. The mineral resource estimate utilized all drill and assay results available to June 23, 2023, including 73,938 meters of drilling by Panoro distributed in 148 drillholes and 9,923 meters of drilling from legacy campaigns distributed in 27 drillholes. The mineral resource estimate includes hypogene and supergene sulphides and mixed/oxide copper-gold and oxide gold mineralization contained within a single conceptual pit shell that has been modelled to include that portion of the mineral resource block model having a reasonable prospect for economic extraction.
The wireframes for the Cotabambas deposit were developed based on mineralization to constrain the interpreted mineralized domains. Latite dikes were clipped from the principal mineralized domains and separated into latite oxide and latite sulfide domains.
The mineral resource estimate in the Indicated and Inferred Categories are summarized in Tables 1 and 2 below. See links to following Figures for illustration:
- Plan 1 - North Pit, South Pit and Expansion Targets’ Plan
- Section 1a - North Pit Lithology
- Section 1b - North Pit Block Model
- Section 2a - South Pit Lithology
- Section 2b - South Pit Block Model
Mineral Resource Statement
Table 1: Mineral Resource in Indicated Category Classified by Mineralization Type
Zone | Cut-Off | Million | Cu | Au | Ag | Mo | CuEq | Cu | Au | Ag | Mo |
|---|---|---|---|---|---|---|---|---|---|---|---|
Leach | 0.15 | 17.0 | 0.19 | 0.22 | 1.80 | 0.0017 | 0.28 | 71 | 0.12 | 0.98 | 0.64 |
Oxide Cu* | 0.15 | 24.7 | 0.31 | 0.22 | 2.26 | 0.0014 | 0.41 | 169 | 0.17 | 1.79 | 0.76 |
Oxide Cu-Au* | 0.15 | 17.3 | 0.43 | 0.15 | 1.79 | 0.0015 | 0.50 | 164 | 0.08 | 1.00 | 0.57 |
Mixed | 0.15 | 32.3 | 0.46 | 0.22 | 2.29 | 0.0014 | 0.58 | 330 | 0.23 | 2.38 | 1.00 |
Supergene | 0.15 | 3.6 | 1.36 | 0.34 | 3.51 | 0.0015 | 1.53 | 109 | 0.04 | 0.41 | 0.12 |
Hypogene | 0.15 | 412.5 | 0.32 | 0.20 | 2.48 | 0.0023 | 0.42 | 2,910 | 2.65 | 32.89 | 20.92 |
Total | 0.15 | 507.3 | 0.33 | 0.20 | 2.42 | 0.0021 | 0.43 | 3,753 | 3.29 | 39.45 | 24.02 |
Note: Base case in bold. Mineral Resources that are not Mineral Reserves do not have demonstrated economic viability. Summation errors may occur due to rounding. Open pit mineral resources are reported within optimized constraining shell. Reported open pit cut-off grade is 0.15%CuEq. Breakeven open pit cut-off grade is 0.07% CuEq. Mineral Resources have an effective date of November 20, 2023. The Qualified Person responsible for this resource statement is Paul Daigle, P.Geo. (APGO, 1592). . Copper equivalent ( CuEq) is calculated using the equations: Oxide: CuEq = Cu + 0.4126*Au + 0.0038*Ag + 0.000*Mo; Mixed: CuEq = Cu + 0.5819*Au + 0.0063*Ag + 0.0003*Mo; Supergene: CuEq = Cu + 0.4498*Au + 0.0054*Ag + 0.0002*Mo; and Hypogene: CuEq = Cu + 0.4373*Au+0.0053*Ag+0.0002*Mo, based on the differentials of long range metal prices net of selling costs and metallurgical recoveries for gold and copper and silver. Metal prices for the CuEq formulas are: US$ 4.25/lb Cu, US$ 1,850 /Oz Au; US$ 23.00 /Oz Ag; and US$ 20.00 /lb Mo. Metal recoveries for the CuEq formulas are for Oxide: 0.0% Cu, 65% Au, 48% Ag, and 0.0% Mo; for Mixed: 60% Cu, 55% Au, 48% Ag, 40% Mo; for Supergene: 87.5% Cu, 62% Au, 60.4% Ag, 40% Mo; and for Hypogene: 90% Cu, 62% Au, 60.4% Ag and 40% Mo. Capping of grades varied between 0.50 %Cu and 3.7%Cu, 0.33 g/t Au and 2.3 g/t Au, and between 0.029%Mo and 0.060%Mo; on 6m composites by domain. The density varies between 2.20 g/cm3 and 2.66 g/cm3. Mineralization would be mined from open pit and treated using conventional flotation. Rounding in accordance with reporting guidelines may result in summation differences. *Oxide Cu - amenable to leaching; Oxide Cu-Au amenable to blending with sulphides (Au >0.25 g/t).
Table 2: Mineral Resource in Inferred Category Classified by Mineralization Type
Zone | Cut-Off | Million | Cu | Au | Ag | Mo | CuEq | Cu | Au | Ag | Mo |
|---|---|---|---|---|---|---|---|---|---|---|---|
Leach | 0.15 | 5.1 | 0.15 | 0.10 | 1.72 | 0.0016 | 0.19 | 17 | 0.02 | 0.28 | 0.18 |
Oxide Cu* | 0.15 | 12.6 | 0.24 | 0.12 | 1.82 | 0.0015 | 0.30 | 67 | 0.05 | 0.74 | 0.42 |
Oxide Cu-Au* | 0.15 | 8.7 | 0.37 | 0.10 | 1.59 | 0.0018 | 0.42 | 71 | 0.03 | 0.44 | 0.34 |
Mixed | 0.15 | 7.1 | 0.18 | 0.15 | 4.57 | 0.0013 | 0.29 | 29 | 0.04 | 1.04 | 0.20 |
Supergene | 0.15 | 1.90 | 0.82 | 0.46 | 3.95 | 0.0018 | 1.05 | 35 | 0.03 | 0.24 | 0.08 |
Hypogene | 0.15 | 460.6 | 0.27 | 0.17 | 2.54 | 0.0028 | 0.36 | 2,742 | 2.52 | 37.61 | 28.43 |
Total | 0.15 | 496.0 | 0.27 | 0.17 | 2.53 | 0.0027 | 0.36 | 2,961 | 2.69 | 40.86 | 29.49 |
Note: Base case in bold. Mineral Resources that are not Mineral Reserves do not have demonstrated economic viability. Summation errors may occur due to rounding. Open pit mineral resources are reported within optimized constraining shell. Reported open pit cut-off grade is 0.15%CuEq. Breakeven Open pit cut-off grade is 0.07% CuEq. Mineral Resources have an effective date of November 20, 2023. The Qualified Person responsible for this resource statement is Paul Daigle, P.Geo. (APGO, 1592). Copper equivalent ( CuEq) is calculated using the equations: Oxide: CuEq = Cu + 0.4126*Au + 0.0038*Ag + 0.000*Mo; Mixed: CuEq = Cu + 0.5819*Au + 0.0063*Ag + 0.0003*Mo; Supergene: CuEq = Cu + 0.4498*Au + 0.0054*Ag + 0.0002*Mo; and Hypogene: CuEq = Cu + 0.4373*Au+0.0053*Ag+0.0002*Mo, based on the differentials of long range metal prices net of selling costs and metallurgical recoveries for gold and copper and silver. Metal prices for the CuEq formulas are: US$ 4.25/lb Cu, US$ 1,850 /Oz Au; US$ 23.00 /Oz Ag; and US$ 20.00 /lb Mo. Metal recoveries for the CuEq formulas are for Oxide: 0.0% Cu, 65% Au, 48% Ag, and 0.0% Mo; for Mixed: 60% Cu, 55% Au, 48% Ag, 40% Mo; for Supergene: 87.5% Cu, 62% Au, 60.4% Ag, 40% Mo; and for Hypogene: 90% Cu, 62% Au, 60.4% Ag and 40% Mo. Capping of grades varied between 0.50 %Cu and 3.7%Cu, 0.33 g/t Au and 2.3 g/t Au, and between 0.029%Mo and 0.060%Mo; on 6m composites by domain. The density varies between 2.20 g/cm3 and 2.66 g/cm3. Mineralization would be mined from open pit and treated using conventional flotation. Rounding in accordance with reporting guidelines may result in summation differences. *Oxide Cu - amenable to leaching; Oxide Cu-Au amenable to blending with sulphides (Au >0.25 g/t).
Grade Sensitivity
Table 3: Sensitivity of Indicated Mineral Resource to Cut-off Grade
Cut-Off | Million | Cu | Au | Ag | Mo | CuEq | Cu | Au | Ag | Mo |
|---|---|---|---|---|---|---|---|---|---|---|
0.07 | 648.3 | 0.28 | 0.16 | 2.18 | 0.0021 | 0.36 | 4,023 | 3.39 | 45.37 | 29.42 |
0.10 | 579.5 | 0.30 | 0.18 | 2.29 | 0.0022 | 0.39 | 3,882 | 3.41 | 42.62 | 27.47 |
0.15 | 507.3 | 0.34 | 0.20 | 2.42 | 0.0021 | 0.43 | 3,753 | 3.29 | 39.45 | 24.02 |
0.20 | 417.7 | 0.38 | 0.23 | 2.61 | 0.0020 | 0.49 | 3,468 | 3.09 | 35.00 | 18.13 |
0.30 | 254.0 | 0.49 | 0.32 | 3.14 | 0.0017 | 0.65 | 2,745 | 2.60 | 25.62 | 9.50 |
0.40 | 166.9 | 0.61 | 0.39 | 3.72 | 0.0014 | 0.81 | 2,250 | 2.10 | 19.97 | 5.15 |
0.50 | 129.0 | 0.70 | 0.44 | 4.12 | 0.0014 | 0.91 | 1,985 | 1.83 | 17.09 | 3.96 |
Note: Base case in bold. Mineral Resources that are not Mineral Reserves do not have demonstrated economic viability. Summation errors may occur due to rounding.
The previous mineral resources (Tetra Tech, 2014) contained 46.3 Million tonnes averaging 0.70%Cu, 0.38 Au g/t, 3.82 Ag g/t and 0.0002%Mo at 0.50%CuEq cut-off. At similar grades, the new resource demonstrates a 296% increase in high-grade resource, including higher gold and silver grades, reflecting the high precious metals content in the South pit.
Table 4: Sensitivity of Inferred Mineral Resource to Cut-off Grade
Cut-Off | Million | Cu | Au | Ag | Mo | CuEq | Cu | Au | Ag | Mo |
|---|---|---|---|---|---|---|---|---|---|---|
0.07 | 1,101.2 | 0.16 | 0.10 | 1.87 | 0.0023 | 0.22 | 3,841 | 3.45 | 66.10 | 55.87 |
0.10 | 760.4 | 0.21 | 0.13 | 2.13 | 0.0026 | 0.28 | 3,492 | 3.12 | 52.15 | 43.54 |
0.15 | 496.0 | 0.27 | 0.17 | 2.53 | 0.0027 | 0.36 | 2,961 | 2.69 | 40.35 | 29.65 |
0.20 | 362.9 | 0.32 | 0.21 | 2.86 | 0.0028 | 0.42 | 2,569 | 2.40 | 33.33 | 22.47 |
0.30 | 202.1 | 0.42 | 0.28 | 3.68 | 0.0029 | 0.56 | 1,869 | 1.82 | 23.88 | 12.86 |
0.40 | 118.1 | 0.54 | 0.37 | 4.73 | 0.0026 | 0.72 | 1,403 | 1.39 | 17.95 | 6.83 |
0.50 | 93.1 | 0.59 | 0.41 | 5.31 | 0.0025 | 0.80 | 1,217 | 1.23 | 15.90 | 5.23 |
Note: Base case in bold. Mineral Resources that are not Mineral Reserves do not have demonstrated economic viability. Summation errors may occur due to rounding.
Higher Grade Component of Mineral Resources
Table 5: Indicated Mineral Resources at a 0.5 %CuEq Cut-off Grade by Mineralization Domain within optimized pit constraint
Zone | Cut-Off | Million | Cu | Au | Ag | Mo | CuEq | Cu | Au | Ag | Mo |
|---|---|---|---|---|---|---|---|---|---|---|---|
Leach | 0.5 | 1.4 | 0.48 | 0.33 | 2.50 | 0.0014 | 0.62 | 15 | 0.02 | 0.11 | 0.04 |
Oxide Cu | 0.5 | 6.1 | 0.62 | 0.32 | 3.36 | 0.0012 | 0.77 | 83 | 0.06 | 0.65 | 0.16 |
Oxide Cu-Au | 0.5 | 6.4 | 0.66 | 0.15 | 1.80 | 0.0015 | 0.74 | 93 | 0.03 | 0.37 | 0.21 |
Mixed | 0.5 | 16.8 | 0.66 | 0.30 | 2.79 | 0.0014 | 0.82 | 245 | 0.16 | 1.51 | 0.50 |
Supergene | 0.5 | 3.6 | 1.36 | 0.34 | 3.51 | 0.0015 | 1.53 | 109 | 0.04 | 0.41 | 0.12 |
Hypogene | 0.5 | 94.7 | 0.69 | 0.50 | 4.61 | 0.0014 | 0.93 | 1,440 | 1.52 | 14.03 | 2.92 |
Total | 0.5 | 129.0 | 0.70 | 0.44 | 4.12 | 0.0014 | 0.91 | 1,985 | 1.83 | 17.09 | 3.96 |
Note: Summation errors may occur due to rounding. Higher Grade Mineral Resources are included within the Indicated Mineral Resources listed in Table 2.
Table 6: Inferred Mineral Resources at a 0.5 %CuEq Cut-off Grade by Mineralization Domain within optimized pit constraint
Zone | Cut-Off | Million | Cu | Au | Ag | Mo | CuEq | Cu | Au | Ag | Mo |
|---|---|---|---|---|---|---|---|---|---|---|---|
Leach | 0.5 | 0.06 | 0.44 | 0.30 | 2.58 | 0.0015 | 0.58 | 1 | 0.001 | 0.01 | 0.002 |
Cu | 0.5 | 1.0 | 0.53 | 0.15 | 2.24 | 0.0016 | 0.60 | 12 | 0.005 | 0.07 | 0.04 |
Oxide Cu-Au | 0.5 | 1.8 | 0.57 | 0.10 | 1.53 | 0.0018 | 0.61 | 23 | 0.01 | 0.09 | 0.07 |
Mixed | 0.5 | 0.4 | 0.44 | 0.25 | 2.77 | 0.0011 | 0.57 | 4 | 0.003 | 0.04 | 0.01 |
Supergene | 0.5 | 1.9 | 0.82 | 0.46 | 3.97 | 0.0018 | 1.05 | 35 | 0.03 | 0.24 | 0.08 |
Hypogene | 0.5 | 87.8 | 0.59 | 0.42 | 5.47 | 0.0026 | 0.80 | 1,143 | 1.19 | 15.45 | 5.04 |
Total | 0.5 | 93.1 | 0.59 | 0.41 | 5.31 | 0.0025 | 0.80 | 1,217 | 1.23 | 15.90 | 5.23 |
Note: Summation errors may occur due to rounding. Higher Grade Mineral Resources are included within the Inferred Mineral Resources listed in Table 4.
Reasonable Prospects for Eventual Economic Extraction
Table 7: Optimized Pit Parameters for the Cotabambas Deposit
Parameters | Units | Oxide, Leach | Mix | Supergene | Hypogene |
|---|---|---|---|---|---|
Metal Prices |
|
|
|
|
|
Copper | $US/lb | 4.25 | 4.25 | 4.25 | 4.25 |
Gold | $US/oz | 1850 | 1850 | 1850 | 1850 |
Silver | $US/oz | 23 | 23 | 23 | 23 |
Molybdenum | $US/lb | 20 | 20 | 20 | 20 |
Metal Recoveries |
|
|
|
|
|
Copper | % | - | 60 | 87.5 | 90 |
Gold | % | 65 | 55 | 62 | 62 |
Silver | % | 48 | 48 | 60.4 | 60.4 |
Molybdenum | % | - | 40 | 40 | 40 |
Other Costs |
|
|
|
|
|
Mining Cost | $US/t | 2.00 | 2.00 | 2.00 | 2.00 |
Processing Cost | $US/t | 4.79 | 4.79 | 4.79 | 4.79 |
G&A Cost | $US/t | 0.41 | 0.41 | 0.41 | 0.41 |
Pit Slope |
|
|
|
|
|
Overall Slope Angle | degrees | 47 | 47 | 47 | 47 |
Dilution |
|
|
|
|
|
Mine Dilution | % | 3 | 3 | 3 | 3 |
Ore Loss | % | 3 | 3 | 3 | 3 |
Exploration Potential
The Cotabambas Project has a number of areas with significant exploration potential:
- Local scale. The stated Mineral Resources at 0.15% CuEq cut-off are a pit-constrained subset of the mineralization block model, where substantial mineralization with higher grades targets extends in different directions. See Plan 1:
i) NE pit target: the high grades at the North Pit (>1.0 %CuEq) make up a corridor of 250m width by 800m length in the northeast direction, which is displaced by an east-west fault. To the north of this fault the area is covered by colluvium representing a promising potential for future drilling and its 2km continuity may connect with the Maria Jose target.
ii) SW pit target: the high grades into the South pit (>1.0 %CuEq) make up a structural corridor of 150m width by 350m length, elongated in southwest direction and open for additional drilling. The geology at surface is composed of a mix of quartz monzonite and latite dikes in the same direction, outcropping along 1.5km.
iii) Intermedium Zone target: located in the area between the North and South pits at the convergence of two main faulting systems in North-South and East-West direction. This structural complexity displaces the mineralization down to the north side and indicates a favorable direction to continue drilling the high-grade body.
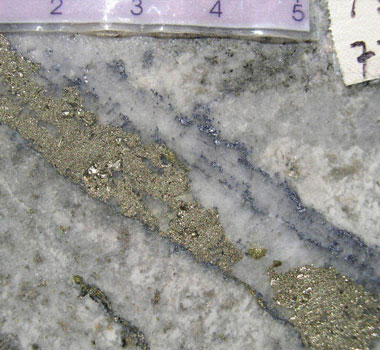
iv) Ccalla East target: this is another porphyry located between 150m to 450m next to the East side of the mineral resources of the North pit, intersected by some drillholes hide some 150m below the diorite host rock outcroppings. The hole CB-68 intersected 194m of hypogene sulfides averaging 0.60%Cu, 0.24 Au g/t and 4.10 Ag g/t. The mineral of this target remains outside of the limits of the new mineral resources pit shell and may represent a split of the Intermedium zone target.
v) NW pit target: located between 400m to 1.5km to the Northwest of the North Pit, grouping the areas of Petra/David drilled in 2017-2018 and the Guaclle Skarn drilled in 2023, accumulating 2,760m of drilling in this target. In Petra-David there are a swarm of quartz-monzonite porphyry dikes with drill intersections up to 79m of copper oxides averaging 0.32%Cu, 0.08 Au g/t, and in Guaclle Skarn two holes intersecting hypogene sulfides of 28m length grading 1.50%Cu, 5,79 Ag g/t and 70m length averaging 0.47%Cu, 2.46 Ag g/t.
vi) Deep Continuity: under the conceptual pit shell constraining the new mineral resources the high grade blocks continue open at depth, following the contact between the porphyry stock and the diorite host rock, but mainly inside the porphyry domain; representing attractive potential to grow the current resources with additional drilling. - District scale. All the targets described in the “Local Scale” make up a cluster of 3km width by 6 km length, where two other targets are incorporated to the north, Buenavista and the Maria Jose Targets (see Plan 1). The mineralization in both targets were identified at surface with mapping and sampling. At Maria Jose geophysics and 5,119m of drilling in 2017-2018 identified intersections in hypogene sulfides of 195m averaging 0.34%Cu, 0.06 Au g/t, 1.60 Ag g/t and 128m grading 0.41%Cu, 0.06 Au g/t, 2.0 Ag g/t, both related with porphyry feeders. Also identified were a swarm of porphyry dikes generating 5 mineral bodies varying from 11 to 19m width and grading between 0.41%Cu to 1.03%Cu. The Maria Jose target is located 1.5km to the North-Northeast side of the mineral resources pit shell and is conform by two mineralized porphyry feeders and a swarm of mineralized dikes intruding the andesite host rock.
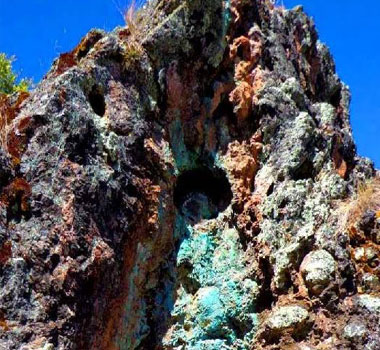
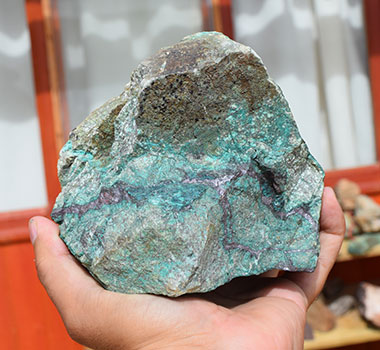
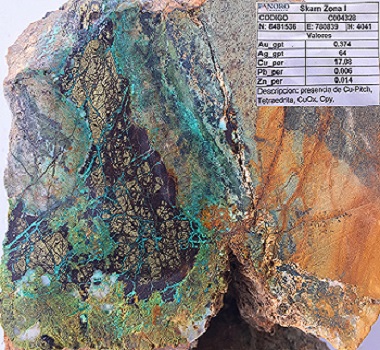
- Property scale. Elsewhere on the property, stream sediment geochemistry and surface mapping have identified six new exploration targets with anomalous levels of copper, gold, molybdenum, lead and/or zinc. The most important were identified over the ridges in the southern areas of the property, such as the porphyry/skarn-style mineralization of Jean Louis, Chaupec and Tamburo targets (See Plan 2). Jean Louis Skarn prospect was mapped in 2014 over an area of 2.8km by 1.6km, based on surface mapping, 433 rock samples and 46 Km of IP/Mag/SP. The Chaupec Skarn was mapped in 2016-2018 over an area of 1km by 3km, based on mapping, 1,997 rock samples, 64km IP, 88km Mag, and 46 km SP. Tamburo target is a new high-grade Skarn body of 60mx30m size exposed in underground workings and remains open in different directions, requires detailed exploration.
The Mineral Resources Technical Report is posted on SEDAR and a link to the report is included below.
February 26, 2024 Technical Report on the Cotabambas Copper Gold Project
Luis Vela, P. Geo., Vice President of Exploration for Panoro and a "qualified person" under National Instrument 43-101, has reviewed and approved the scientific and technical information.